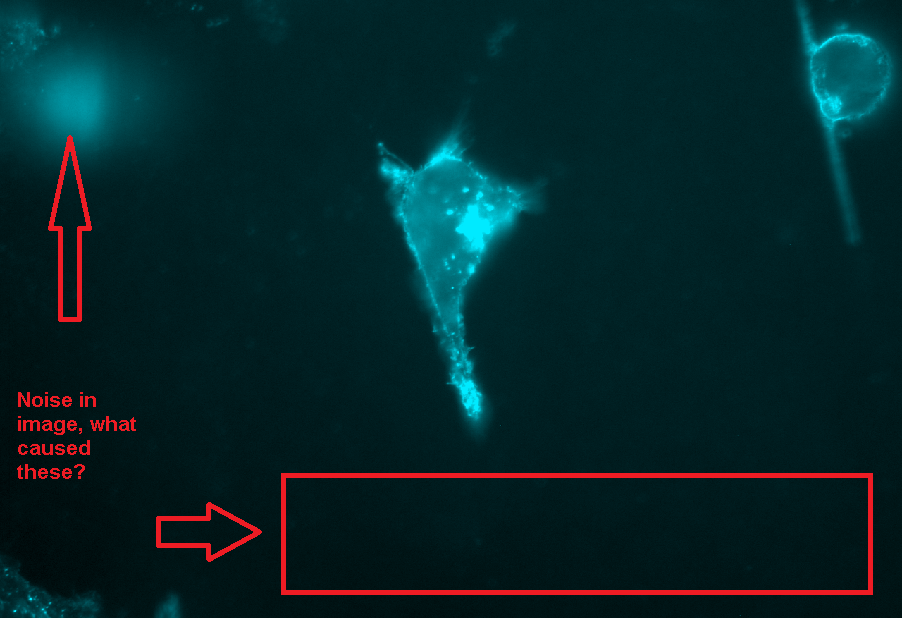
For microscopy engineers and suppliers like me, the background produced in an image is of importance, if that background is created by the imaging system itself. What so many of us on this side of the scope (vs the user side) forget to train on and talk about is the specimen side of the background. So, how can you figure out where the background is coming from in your image?

Background Sources
Usually background sources mentioned are those produced by the imaging system. I’d like to cover instead those produced by the specimen and the imaging system. These can be:
System Background Sources
- Fluorescent filter crosstalk/performance limitations
- Objective and other optical limitations (aberration/convolution etc.)
- Camera measurement noise (A/D Read Noise)
- Camera-produced background noise (heat that the camera sees as signal)
Specimen Background Sources
- Auto-fluorescence produced by cells and/or media
- Refraction/reflection of excitation light by specimen container (think plastic multi-well plate)
- Ambient light in the room where the microscope is located
- Byproduct remaining from sample preparation protocol (stain that remains after a rinse, etc.)
Identification and Removal
Instead of reviewing each noise source type and it’s cause, let’s instead perform a gross identification scheme to determine where the greatest noise source exists.
Method 1: System vs. Specimen Measurement
- Configure your microscope and imaging system, and place your specimen on the scope.
- Focus on your specimen.
- Acquire 2-3 images of various locations of the specimen.
- Remove the specimen from the microscope entirely, not changing the scope at all (don’t drop the focus or change filters).
- Acquire 2-3 images with the scope in this state.
- Using either the ROI tools, or other tools available in your software of choice, measure the average intensity value, for the non-exciting area of your 2-3 specimen-present images, that we acquired in step 3.
- Measure the entire image field of the 2-3 images we acquired in step 5.
- We now have an intensity measurement of the amount of background for the imaging system + specimen, and the imaging system only.
- If the image intensities remain relatively unchanged between the two image groups, the source of noise is in the imaging system.
- If the intensities from the images in step 5 are significantly lower than those from step 3, noise is being produced by the specimen, or specimen container.
In my next post I’ll cover how to further pinpoint noise sources, and how to eliminate them.
– Austin