This is a tough problem to solve: How does one analyze quantity of stain on an H&E slide?
The fundamental problem with conventional thresholding has to do with the tool function vs. the expression of the stains.
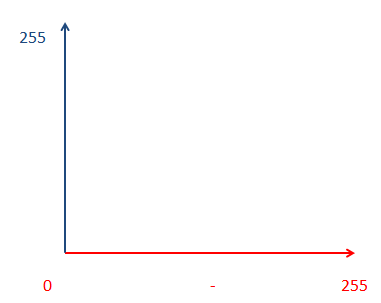
Any threshold tool one can use with a visual interface, will effectively give you a block of intensities to threshold. Consider that the H&E image, is comprised of 3 color channels, Red, Green and Blue. Software packages will allow you to threshold using “HSE” or “RGB” types of tables, but fundamentally, you are always playing with a color cube of sorts. One way of looking at this is via the example below. First, we can control a minimum threshold for the red channel:

This is a single axis threshold. All we can select here is what the minimum threshold is, and what the maximum threshold number is.
Next, we need to add in the Blue channel:

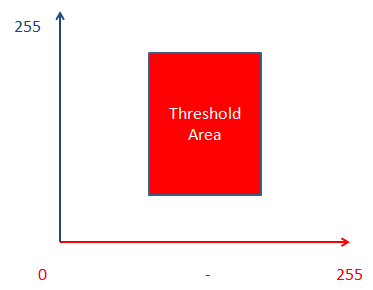
Here we can see that the threshold could occupy some box of brightness values. The box of intensities can be defined by Red min/max, + blue min/max.Note that so far, I have not actually represented any threshold control in these graphs, we are simply setting up the boundaries of the threshold in multiple channels.
So – let’s add the threshold now. Say we wanted to add a threshold of a value red min = 75, max = 150 and blue min = 55, max = 200. Our threshold would look something like this:
So, we have this nice two channel threshold. But the problem is, that the software never seems to correctly capture all of the stain(s). Either the very dense stained areas become convoluted, or the very faint stained areas are lost. It seems that no amount of fiddling can ever correctly capture the H&E labels. So, what’s the cause of this trouble? It turns out that a while back some researchers at the University of Texas took a look at this problem, and figured out a solution. ( Ruifrok AC, Johnston DA. Quantification of histochemical staining by color deconvolution. Anal Quant Cytol Histol 23: 291-299, 2001.) You can find an online copy of the full paper here , which I suggest reading before attempting to use or rely upon this method for your work. You must be careful in how you white balance your images in order to use this!
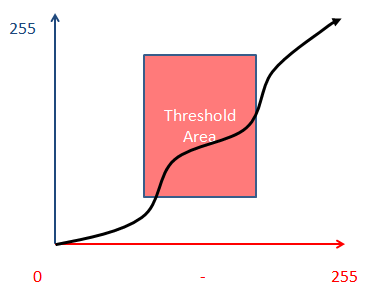
The bottom line is that as each label, or rather any pigment-based dye, increases it’s “presence” it not only changes the brightness of it’s color, but the color itself is changed! What this basically does is present the following situation:

Obviously my cartoon above is not an accurate depiction of the behavior of any label, however it hopefully shows the problem. We are using a square definer to cover a nonlinear profile. This is the core cause of thresholding difficulty with H7E or similar specimens.
So, there is a tool available, which is called “Colour Deconvolution” and which will run in both ImageJ and Fiji. The tool must be calibrated for use, but in a nutshell you use the tool to specify each stain independently for calibration, then feed the tool your multi-stain image. What you get in return is an “image” representing only the single label density for the labels you’ve loaded into your specimen.
I have yet to see this work ported into any major software packages, so in the meantime if you’re working with classic stains, and need to do high volume analysis, this is by far the best option to work with.
-Austin
