In my last post I explained how images are really three dimensional structures inside of your computer, and what exactly bit depth is. Today I’d like to finish up discussing how this boils down to trouble in viewing, saving and in general, working with scientific images.

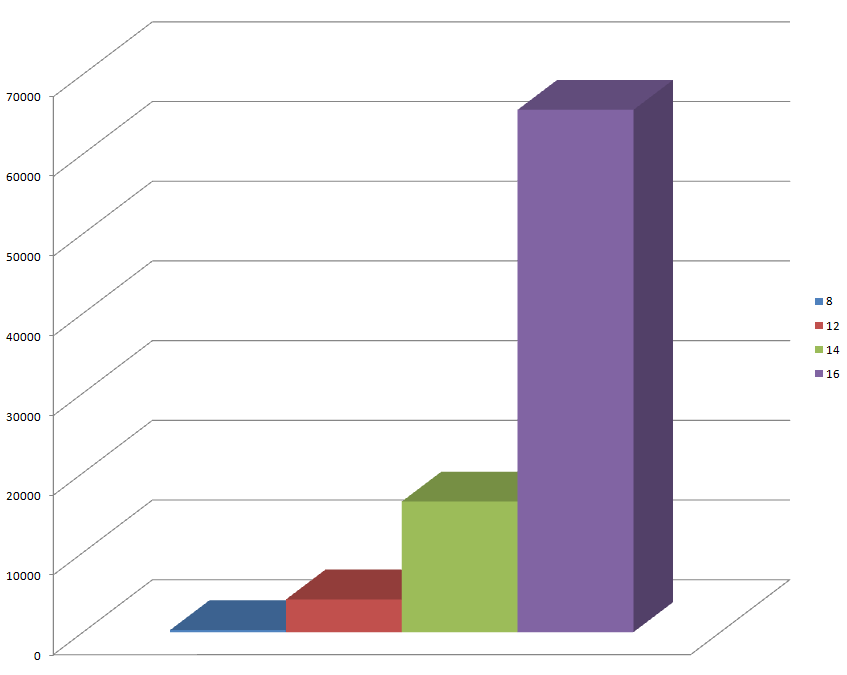
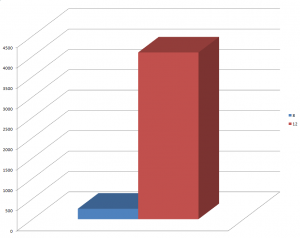
Remember that images can contain any bit depth as specified by a program (or you) when the image is created inside of the computer. Above is a graph indicating the maximum values allowable for each bit depth image type. Obviously we want the highest measurement accuracy, or highest bit depth, when using our scientific detector (camera).
The tough part comes when you want to view the data that is filled into the image from your camera. Consider the progress of acquiring an image, and displaying it:
- Light falls onto camera (CCD or CMOS)
- Light is Converted into an electrical charge per pixel.
- Each pixel is measured, and the measurement number is sent to an empty image memory space in the computer. (This is the point at which the image is converted from the analog world on the CCD or CMOS sensor, into it’s digital format on the computer)
- Based on the camera type, the image may be sent to the computer with an 8, 12, 14 or 16 bit depth.
- Once the image is in the computer, either in memory or saved into a file, the image is displayed on the monitor, in a mode where higher numeric values represent brighter output levels on the screen.
Understanding step 5, and how it works, is key here. The problem with how we display image numbers (commonly referred to as “counts”) is really based on our eye. The human eye is more sensitive to hue variations than it is to brightness variations . It results that there isn’t a good reason to engineer a display that has higher output resolution than what we can see, so almost all display systems are set to 8 bits per channel of output. But wait! What about those super cool Sharp Quattron displays?
Color displays use a combination of Red, Green and Blue Primary additive color to render an image to the eye. So, one pixel will contain levels of brightness in RGB, at brightness levels from 0 to 255 (8 Bit). 8 Bits *3 channels gives us the typical 24 bit color display in use in most displays we work with. Systems like the Quattron or other 32+ bit displays will either add another color (Yellow in the case of Quattron) or use different color channel combinations, to increase the overall range of colors the display can output.

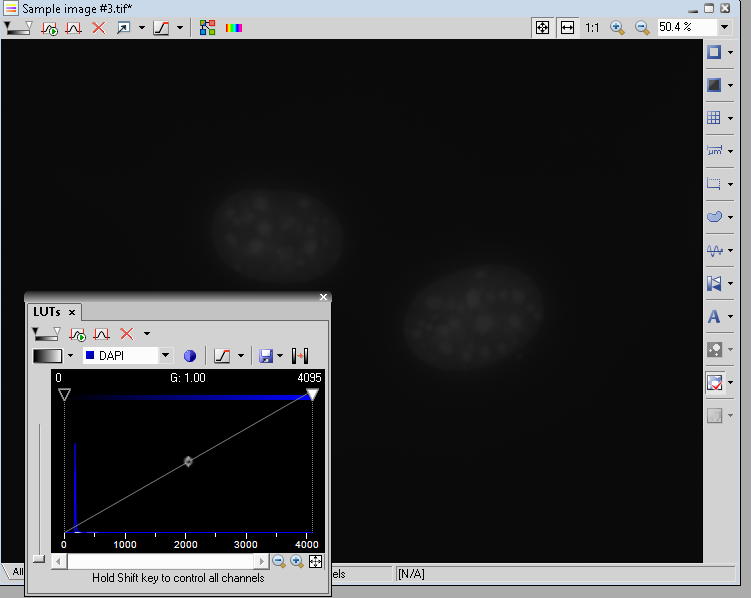
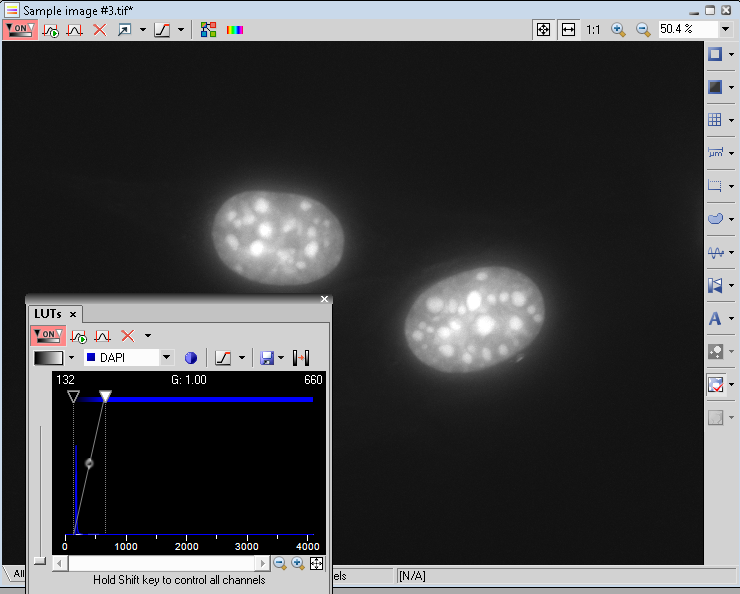
What this means to the user of a scientific camera is that there is more fidelity in the image than what the monitor can push out. If using a 12 bit camera, and an 8 bit monitor, we must handle the data one of two ways: We can simply divide the 12 bit data using a divisor that will fit the maximum 12 bit value into the maximum 8 value. Using this method we will lose all of the data that is binned into the 8 bit ranges, as these numbers are full values and not floating point. Or, we can arbitrarily select our own minimum and maximum display values from the image, and use what’s in between for the display on the monitor. The latter scenario makes sense in almost all applications, because most end users will never fill up the 12 bit range used by the camera. Here are two example images where one is simply divided to fit 8 bit display, and the other is scaled to show the highest pixel value in the image = full brightness (255) on display, and the minimum pixel value in the image = zero brightness (0) on display:


So the only difference between these two images is how they are displayed onto the monitor. In the top image, 4095 = 255 on screen, whereas in the lower image 662 = 255 on screen. Obviously the more intense output rings up the overall contrast. Now, here we find one of the major differences between analytical imaging software and photo processing software like Photoshop or picasa. using software like NIS Elements, or Metamorph or ImageJ, adjusting levels has no alteration on the actual image data. For example I can pull measurements from either the top or bottom image in elements, and the min, max and mean values will all be the same. This is because elements is measuring the data values whereas the screen is showing the data values + scaling. Now if I use the often-abused “Adjust Scaling” tool in Photoshop, my intensity values will be permanently altered. So – for standard viewing and display work, Photoshop or other photography programs fit the bill. For quantitative analysis of intensities, we want to stick with analytical software, to ensure our data is measured properly.
But I Still can’t see my image in Photoshop! C’mon!!!
Monday will conclude this series with image saving, and what’s going on with Photoshop. In the meantime, can anyone guess what the reason is based on the information presented so far? A hint: it has to do with the difference between analytical and photography software….
-Austin
(Update – You can find the last installment of these episodes here)